Underwater Vision Profiler 5 HD (UVP)
- PI
Andrew McDonnell (University of Alaska, Fairbanks)
- Cruise Participant
Stephanie O’Daly (Lead, Ph.D. Student, University of Alaska, Fairbanks)
Kurtis Anstey (Secondary, M.S. Student University of Victoria)
System Configuration and Sampling
The Underwater Vision Profiler 5 (UVP5) HD (High Definition) serial number 201 was programmed, mounted on the rosette, and charged. This instrument is owned by Emmanuel Boss at University of Maine. The UVP5 is outfitted with a High Definition 4 Mp camera with an acquisition frequency of up to 20 Hz. This optical imaging device obtains in situ concentrations and images of marine particles and plankton throughout the water column, capturing objects sized ~100 µm to several cm in diameter. The camera of the UVP5 HD is different from the previous non-HD version, but the operations are identical for both. The instrument and data processing are described in [Picheral2010]. Depth trigger mode was used throughout the entirety of the cruise, programmed to turn on at 15 m with a maximum depth of 6000 m. A 20 m soak for one minute was used throughout the cruise.
Problems
On station 011 cast 01, the UVP voltage read 0 on deck after the CTD was powered on. The voltage came up to a non-zero number when the rosette hit the water, but it didn’t appear that the UVP turned on during the one-minute soak at 20 meters. After the cast, corrosion was found between the power shunt and the 1m power cable extension indicating seawater intrusion. No data was collected on this cast. Those parts were swapped out for spares and this problem did not occur again. A reading of 0 volts on the deck indicates that a good seal has not been made between the power shunt and the 1 m power cable extension. If this is found again in the future the power shunt should be inspected and replaced on the 1 m power cable extension. Additionally, we started drying and greasing the power shunt before application before every cast as instructed by the instrument manufacturers. Cans of compressed air can be used to dry the shunt or the ship’s air compressors.
Once we left the Japanese EEZ and Bio Casts started happening separately from core casts we started having other issues with the UVP. On station 026 cast 02 the UVP did not save all of the associated metadata files that allow us to process the particle size distributions. On station 027 cast 01 the UVP shut off at 1100m on the downcast. Then on station 029 cast 02 the UVP did not save all of the associated metadata files again. I believe these issues are due to the limited charging time after the Bio Casts before the full casts. We started dummying up the UVP for bio casts and only running it for the full casts and these issues did not occur for the rest of the cruise.
The last and most consequential issue we ran into with the UVP on this cruise occurred after station 057 cast 01. We were able to download and delete the data from the UVP for this station, but when I tried to perform a light test the UVP did not respond to any commands. I swapped out all associated cabling for spares and the deck box for a spare deck box and this did not establish good deck communication with the UVP. After discussing with the manufacturers, we decided the issue is likely a bad Sea Data bulkhead connector. I continued running the UVP for every core cast and it appeared to turn on based on the CTD voltage and by visual inspection of the lights at the surface for the rest of the cruise. I was never able to establish communication with the instrument again and therefore was not able to download data. Based on my calculations there should be enough space on the internal memory card for the rest of Leg 1 and Leg 2 of P02 if the particle concentrations are similar to the first 57 stations. When the internal memory card is full the instrument will not turn on anymore. The instrument will be run until this occurs, if at all, on Leg 2. Then the instrument will be sent to the manufacturers for maintenance who will open the bulkhead and hopefully download the data from the remaining stations.
General Particle Patterns
Near Japan, we see medium particle abundance overall with a surface and subsurface particle abundance maximum. A deep nephloid layer is not present and with there is a medium mean particle size increases with depth (Fig. 1). In the Kuroshio current, we see low particle abundance at the surface and subsurface with a very strong deep nephloid layer (high particle abundance) reaching 500 m above the seafloor (Fig. 2). Off the Japanese continental shelf, we see a strong surface particle abundance maximum at around 100m with a large average particle size and a subsurface particle maximum at around 400 m with low average particle size, and low particle abundances down the seafloor (Fig. 3). At the off-shelf stations, we see lower particle abundances with moderate surface and subsurface particle abundance maximum and no deep nephloid layer (Fig. 4).
Future Data Analysis
Total image count gathered during the cruise from the first 57 stations was 585,700 images. A combination of machine learning and manual validation will be used to sort images using the Ecotaxa database. Images will be sorted into various zooplankton taxa and detrital categories. Zooplankton categories will include crustacea (including copepods and krill), gelatinous (larvacean, jellyfish, salps), and rhizaria. Examples of these images are shown in Fig. 5.
Figures
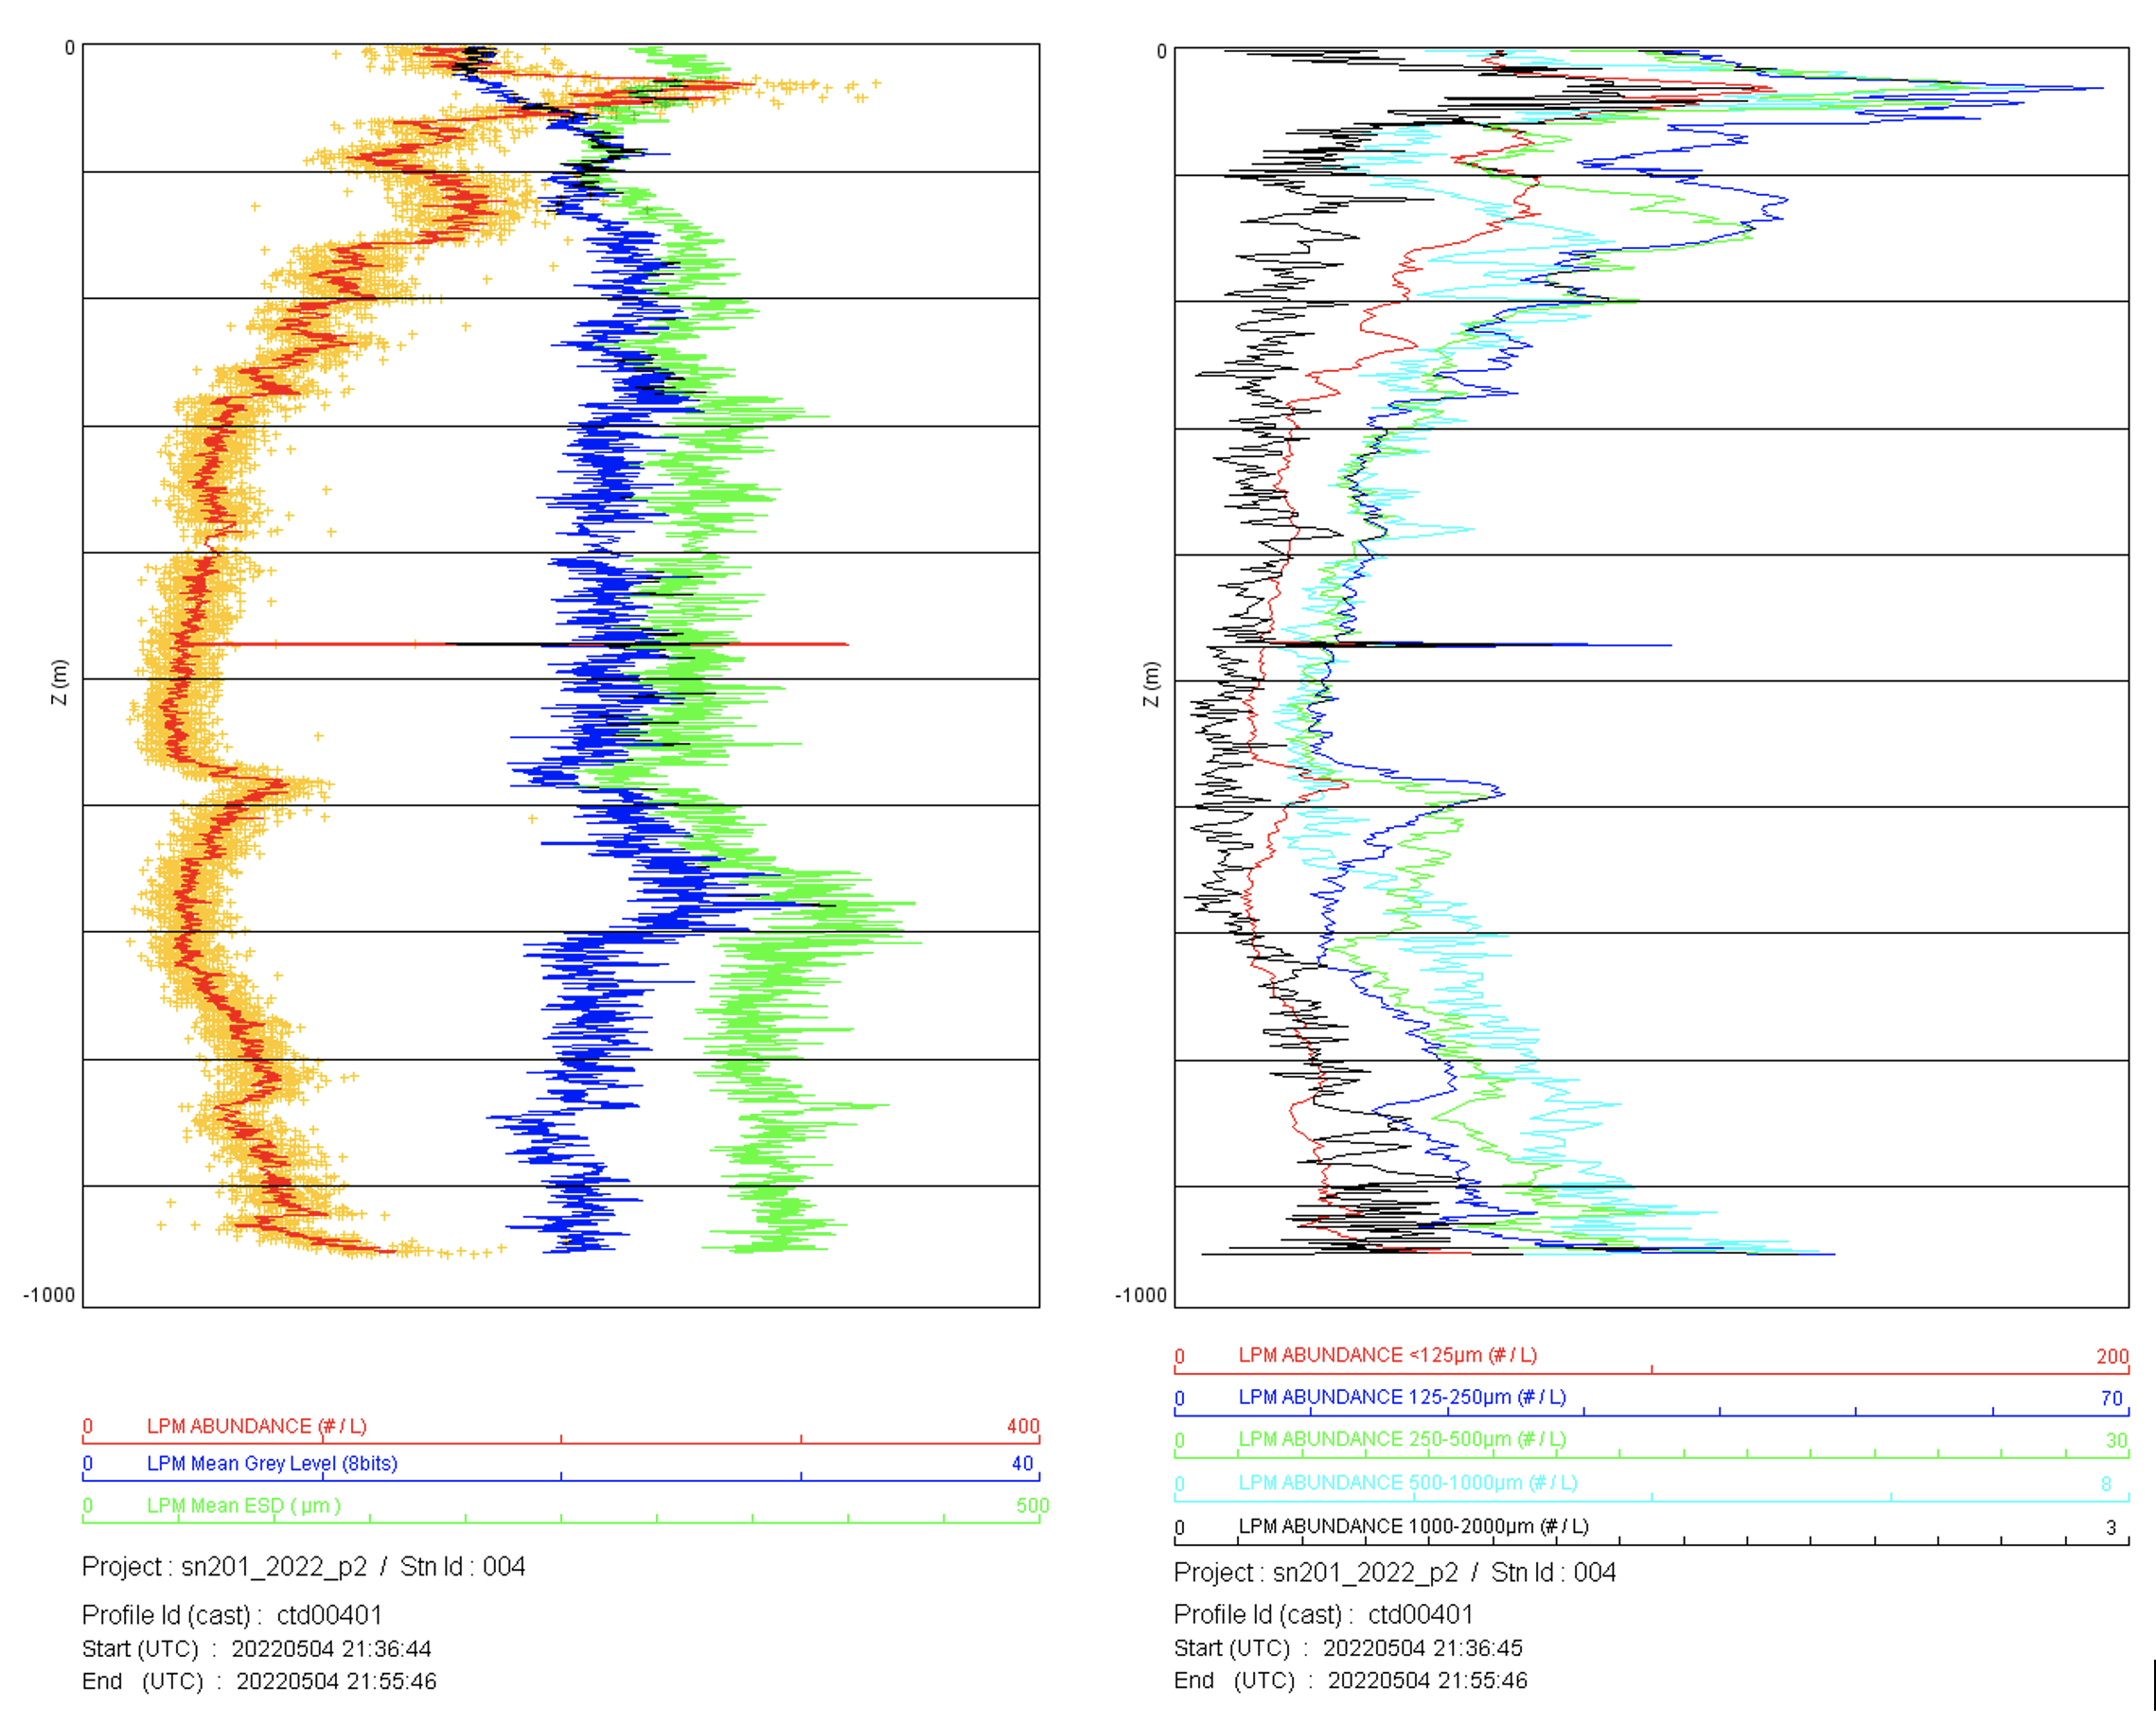
Fig. 1: Examples of preliminary profiles at station 4. Plots show total large particulate matter (LPM) abundance, mean grey level (brightness) of LPM, and equivalent spherical diameter (ESD) (right) and particle concentration in size bins (left) both plotted against depth (meters). Near Japan, we see medium particle abundance overall with a surface and subsurface particle abundance maximum. A deep nephloid layer is not present and with there is a medium mean particle size increases with depth.
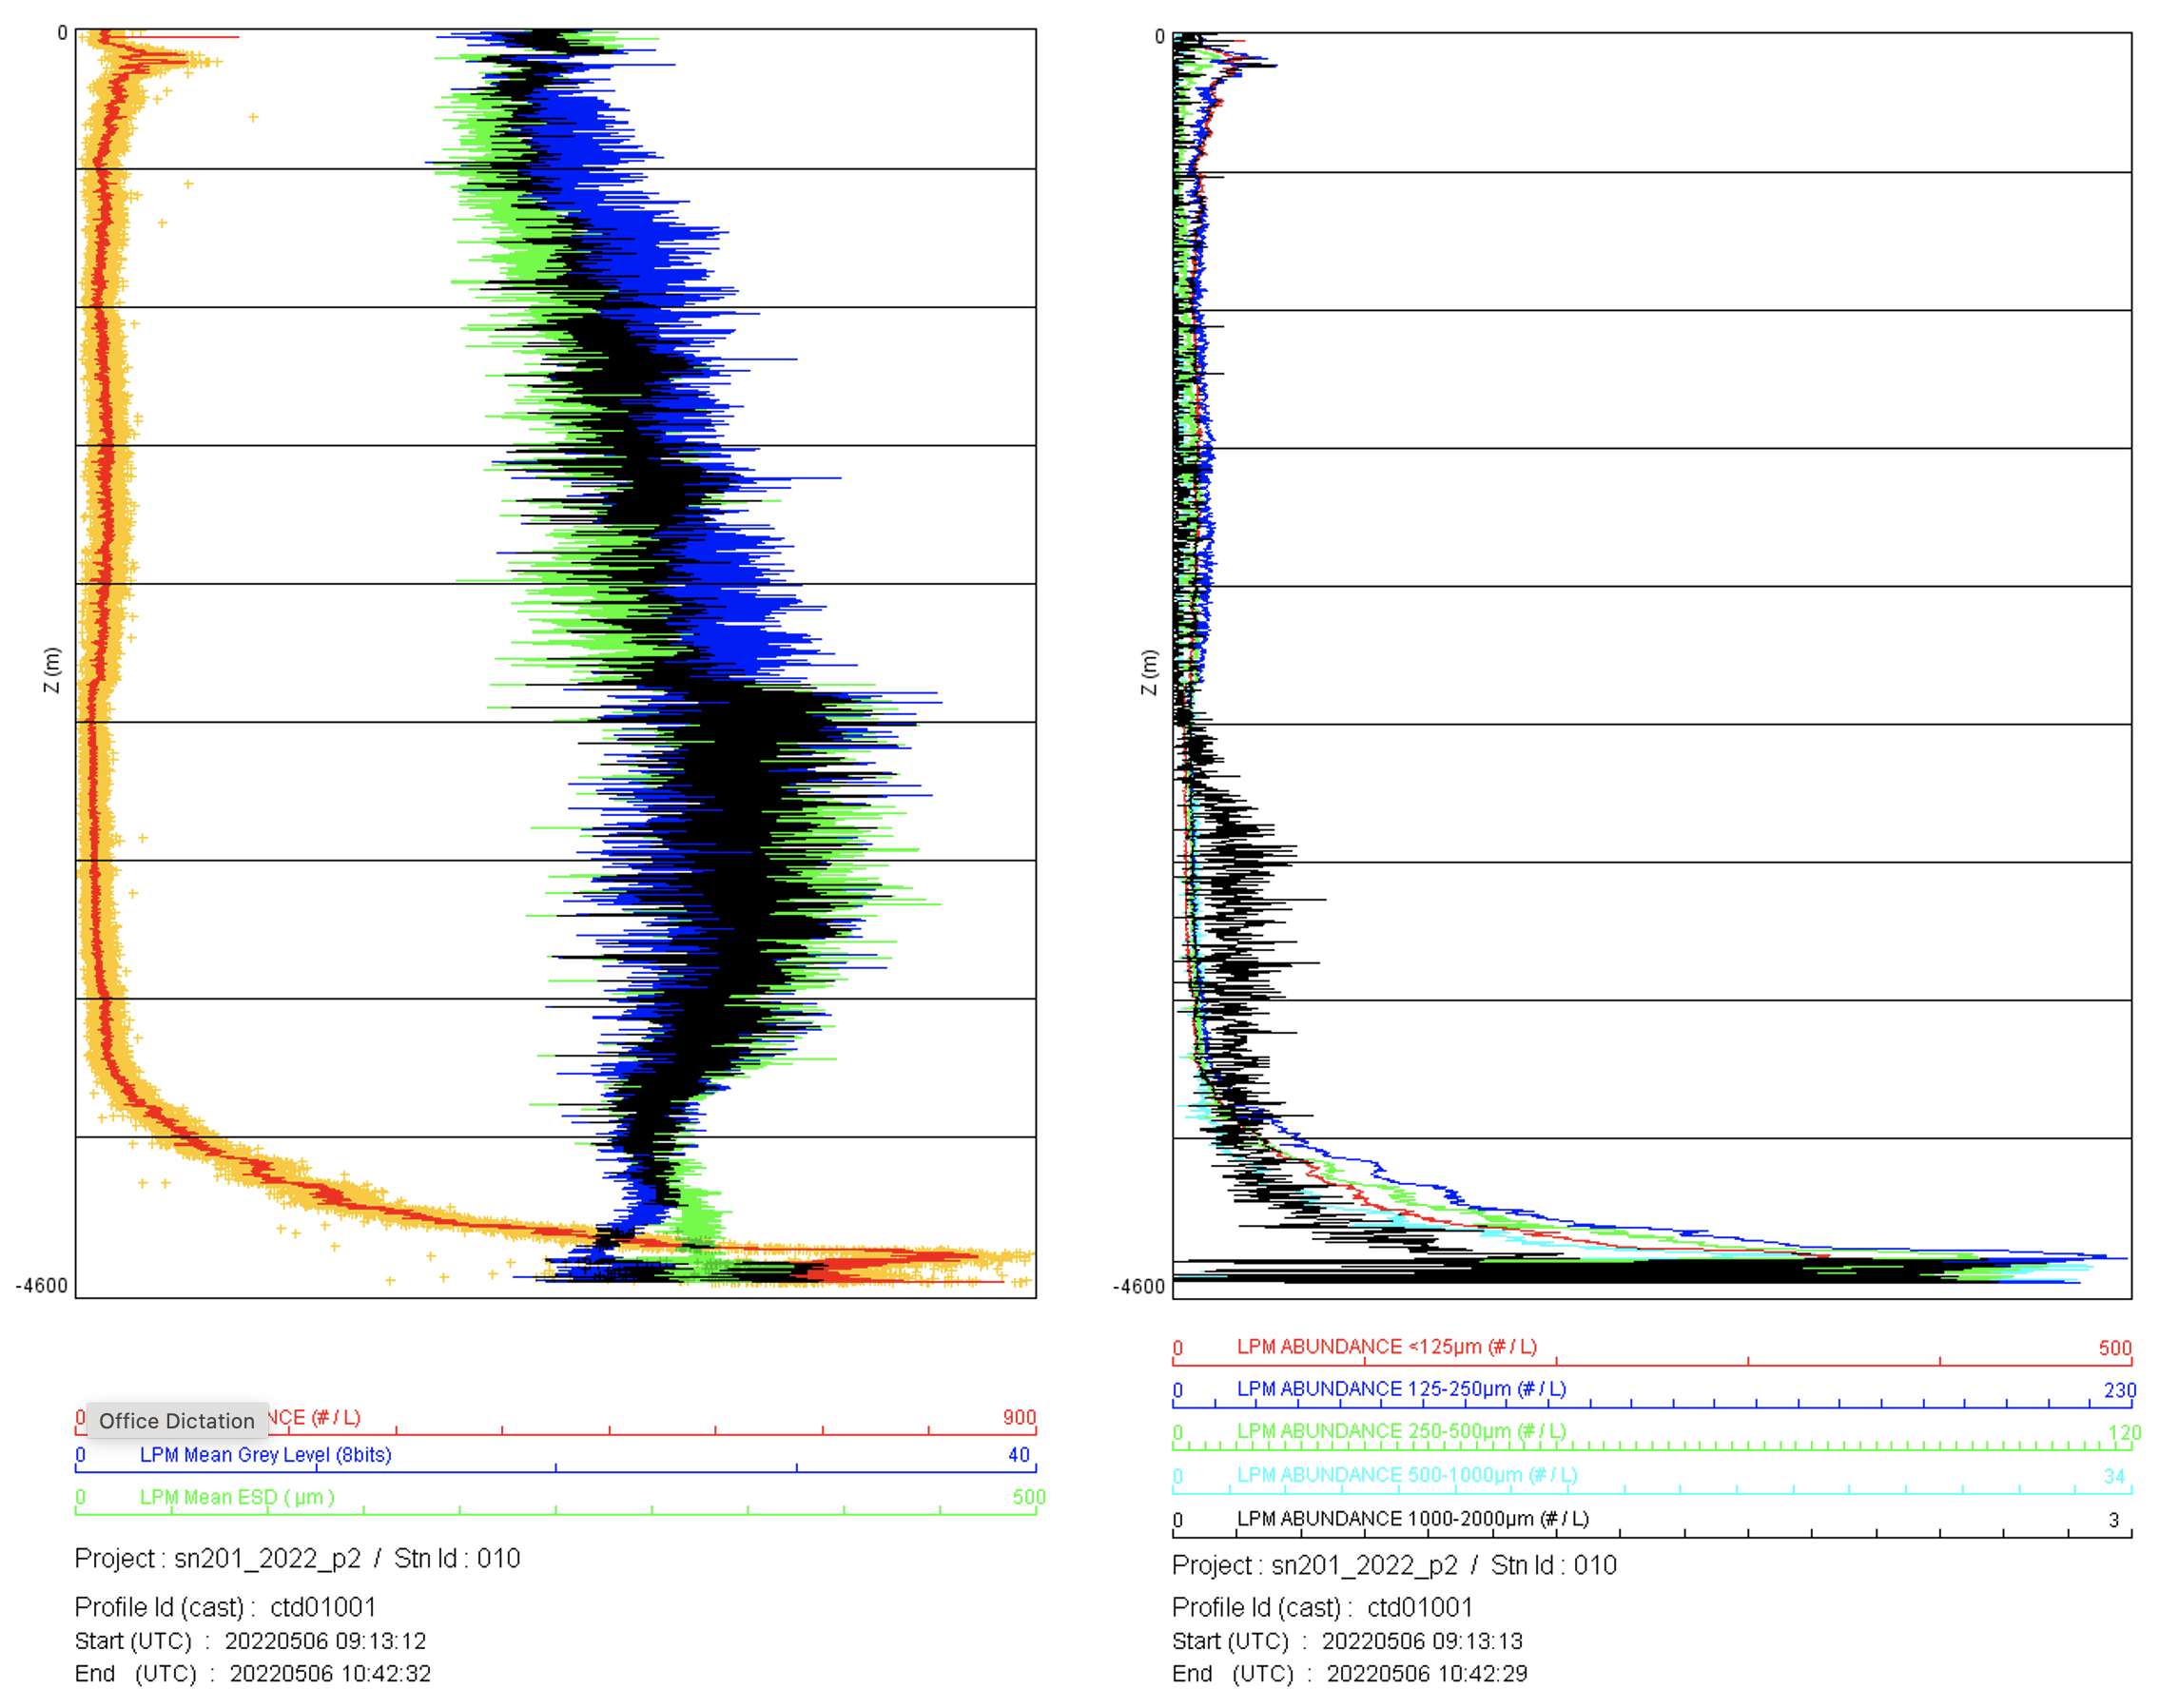
Fig. 2: Examples of preliminary profiles at station 10. Plots show total large particulate matter (LPM) abundance, mean grey level (brightness) of LPM, and equivalent spherical diameter (ESD) (right) and particle concentration in size bins (left) both plotted against depth (meters). In the Kuroshio current, we see low particle abundance at the surface and subsurface with a very strong deep nephloid layer (high particle abundance) reaching 500 m above the seafloor.
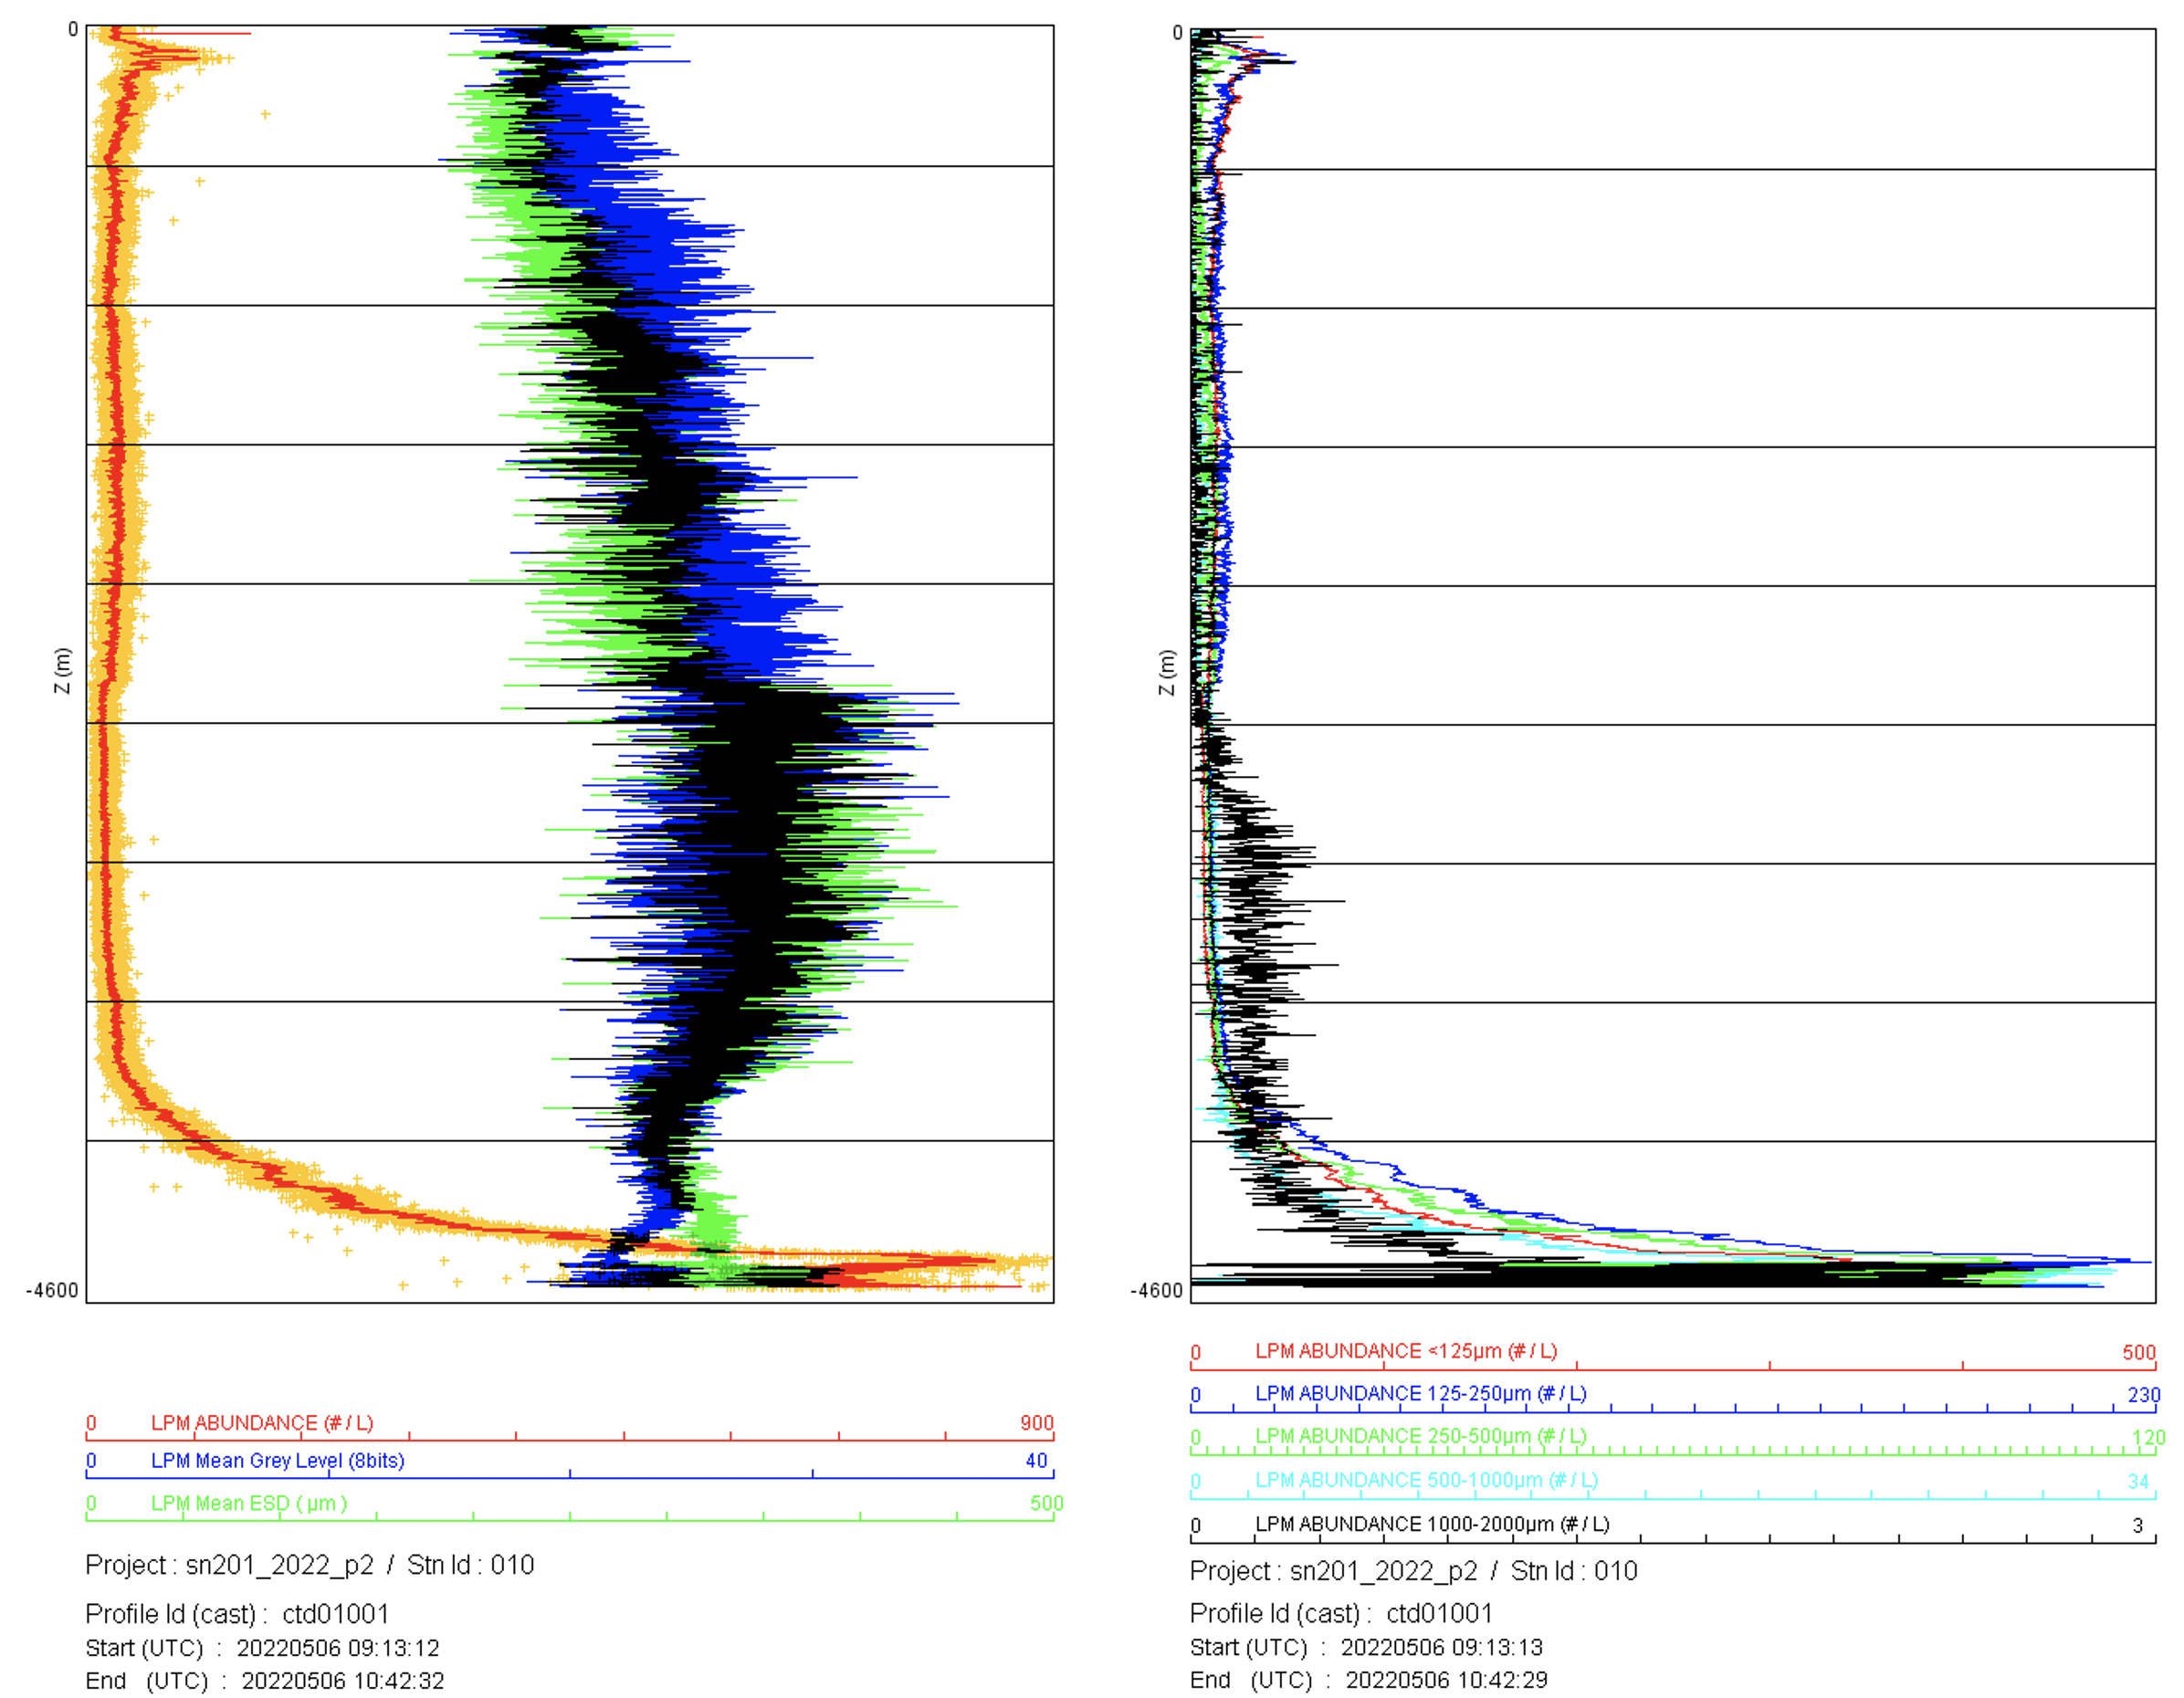
Fig. 3: Examples of preliminary profiles at station 20. Plots show total large particulate matter (LPM) abundance, mean grey level (brightness) of LPM, and equivalent spherical diameter (ESD) (right) and particle concentration in size bins (left) both plotted against depth (meters). Off the Japanese continental shelf, we see a strong surface particle abundance maximum at around 100m with large average particle size and a subsurface particle maximum at around 400 m with low average particle size, and low particle abundances down the seafloor.
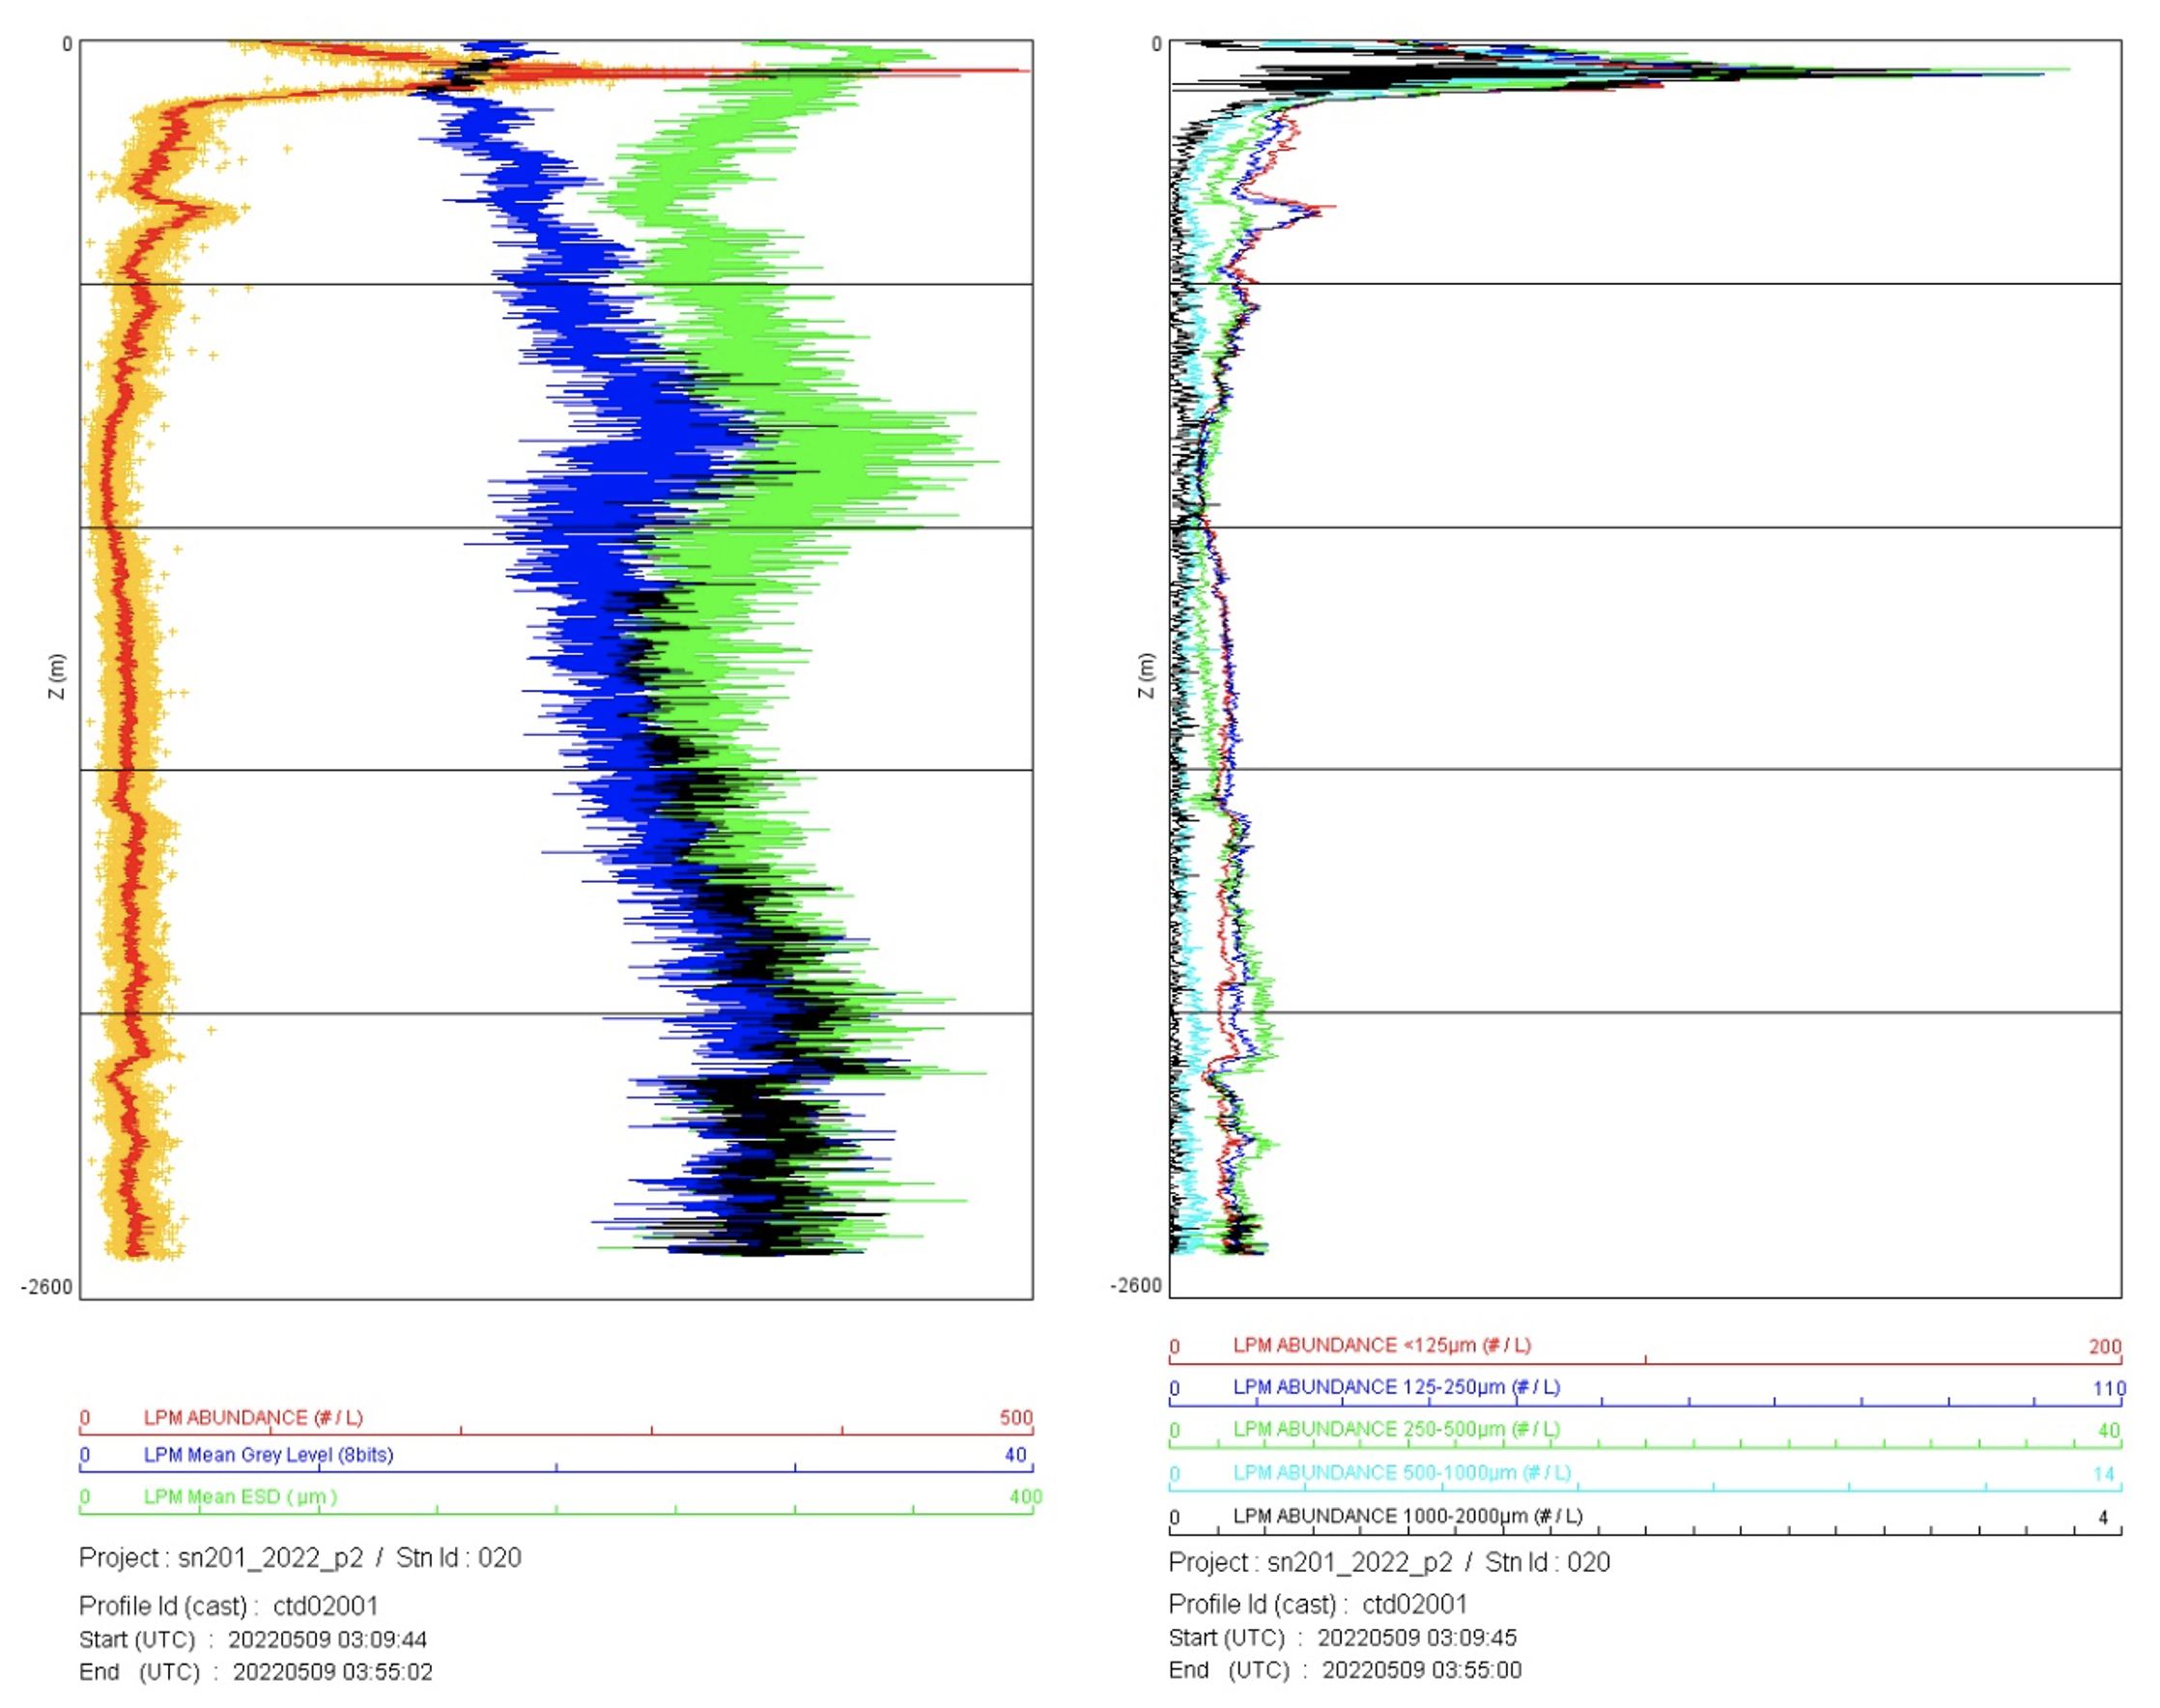
Fig. 4: Examples of preliminary profiles at station 51. Plots show total large particulate matter (LPM) abundance, mean grey level (brightness) of LPM, and equivalent spherical diameter (ESD) (right) and particle concentration in size bins (left) both plotted against depth (meters). At the off-shelf stations, we see lower particle abundances with moderate surface and subsurface particle abundance maximum and no deep nephloid layer.
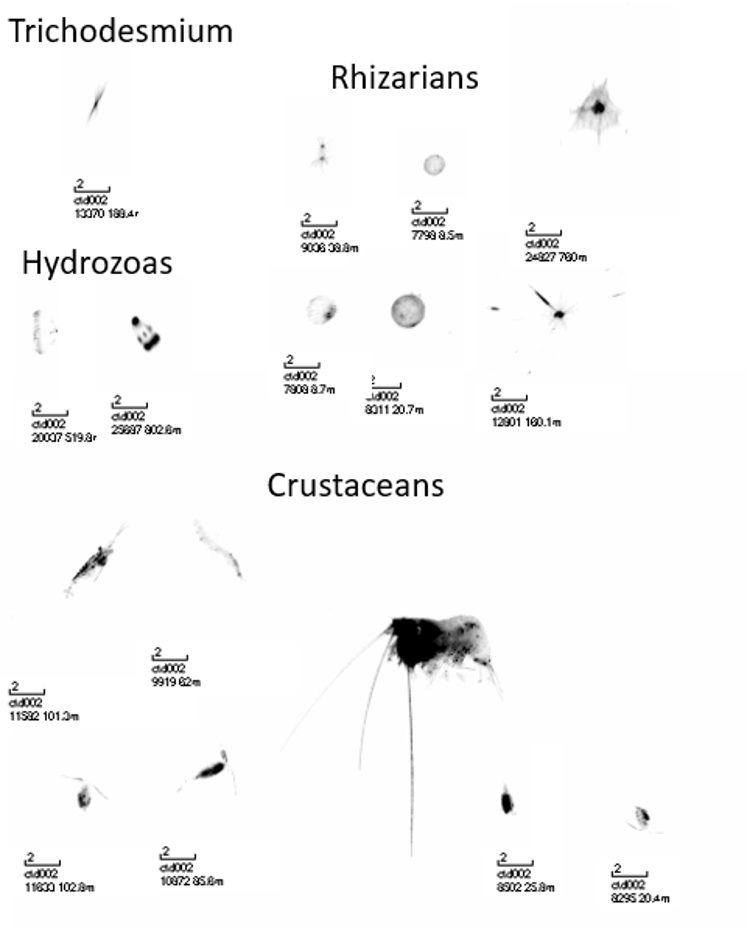
Fig. 5: Examples of particle and plankton images captured by the UVP5HD and processed by custom software. The scale bar indicates 2 millimeters. Station number, image number for that cast, and depth at which the image was captured are also given in the image.
- Picheral2010
Picheral, M., Guidi, L., Stemmann, L., Karl, D.M., Iddaoud, G., Gorsky, G., 2010. The Underwater Vision Profiler 5: An advanced instrument for high spatial resolution studies of particle size spectra and zooplankton. Limnol. Ocean. Methods 8, 462–473.