LADCP
- PI
Dr. Andreas Thurnherr (LDEO)
- Cruise Participant
Kurtis Anstey (University of Victoria)
Data Acquisition and QC
To collect full-depth profiles of horizontal and vertical ocean velocities, two acoustic Doppler current profilers (ADCPs), one facing upward (uplooker, UL) and the other downward (downlooker, DL), as well as a DeepSea Power & Light rechargeable 48V battery and cables, were installed on the conductivity, temperature, depth (CTD) system rosette. The lowered ADCP (LADCP) system was provided by the Lamont-Doherty Earth Observatory (LDEO). The LADCP system is self-contained, requiring on-deck cable connections via a five-wire star-cable to charge the battery and communicate. Each end of the star-cable had a short extension cable attached to mitigate wear. The battery charger was affixed to an elevated power box in the hanger, with an extension power cable run into the wet lab to be plugged in near to the hanger door. Installed on the bench were the LADCP data acquisition computer, a Mac Mini, and a bench-top power supply for the ADCPs.
While cruising the LADCP system in the hanger was left connected to the (unpowered) battery charger, as well as to two deck cables leading to the data acquisition computer and the bench-top power supply. The male plug of the (disconnected) adapter cable between the battery and the LADCP star-cable was dummied. While the deck cables in the wet lab were permanently connected to the acquisition computer with RS232-to-USB adapters, the corresponding power supply was turned on and off with a toggle adapter. With this setup there is no voltage to any of the LADCP cables on the rosette.
A few minutes before rosette deployment, the battery was disconnected from the charger and connected to the LADCP system via the extension power / star-cable. The male plug of the battery charger cable was dummied. To begin data acquisition, the instruments were woken up by the acquisition computer by checking storage contents, data from the previous cast deleted from the built-in memory cards, and the instruments programmed to start pinging. The two deck cables were disconnected from the two star-cable extensions. The deck cables and star-cable extension connectors were dummied, and the latter secured to the rosette frame with velcro straps to avoid excessive motion during the cast. The CTD operator and/or res-tech were notified that the LADCP system was ready for deployment. Deployment information was recorded on LADCP log sheets, either when the data acquisition was started or once the CTD system had entered the water.
Upon recovery, the velcro straps securing the dummied star-cable extensions were removed, as well as the dummies, the cable ends rinsed with fresh water, and the star-cable extensions connected to the deck cables (also un-dummied). Using the acquisition computer, LADCP data acquisition was stopped by initiating the data download. The bench top power supply was activated, the LADCP battery disconnected from the adapter cable on the rosette, the male end of the battery adapter cable on the rosette with two exposed pins now carrying 48V (from the bench-top power supplies) dummied, and the battery cable attached to the (still unpowered) battery charger cable. Power was applied to the battery charger via an accessible power toggle switch below the charger, and the time noted on the LADCP log sheet.
After data from the cast had finished downloading (about 20 minutes for deep casts), the bench top power supply was deactivated with the bench power toggle switch. The new data files (one for each the UL and DL) were roughly quality-checked by integrating the measured vertical velocities in time, yielding estimates for the maximum depth (zmax) and the end depth (zend) of the profile, and these values recorded on the log sheet. Once the battery was fully charged (usually about an hour after charging was initiated, as indicated by the charger LED status) the charger was disconnected from power, and the time noted on the log sheet. At this stage, the LADCP system was ready for the next cast.
Communication between the acquisition computer and the LADCP system was handled by Thurnherr’s custom acquisition software (acquire2), implemented as a set of UNIX shell commands designed to minimize the possibility of operator error. Primary commands are:
Ldir: Lists the status of the LADCP memory, including number of files, file size, etc.
Lstart: Wakes the instruments, lists their memory contents, clears the memory (after operator confirmation), and instructs the instruments to begin pinging by uploading command files. CTD station and cast number must be provided by the operator, as the LADCP files use an independent numbering scheme.
Ldownload: Interrupts the running data acquisition, downloads data, and backs up data files.
Lcheck: Integrates the measured vertical velocities from both the UL and DL to estimate zmax and zend, which are displayed with other useful profile statistics before data files are backed up, again.
Lreset: Resets the LADCP system after swapping instruments or in case of communications issues.
After each cast, data were quality-checked with an initial processing run of both horizontal and vertical velocities. CTD .cnv data were obtained from the ship’s shared drive and processed into 1 and 6 Hz formats. These were used with LADCP_w (vertical velocity) and LDEO_IX (horizontal velocity) processing software to produce diagnostic logs, figures, and post-processed data files. Additionally, LADCP data quality was continuously monitored via horizontal velocity section plots (Figure 1), useful for identifying large-scale data inconsistencies. A written assessment, diagnostics, and figures were sent to Thurnherr’s lab in Lamont via rsync. A more comprehensive post-cruise data quality-check will be carried out by Thurnherr in his lab before submission of the combined leg 1 and 2 data to the archives.
Instrumentation
Two 300kHz Teledyne RDI Workhorse Monitor ADCPs (WHM300HZ) were used at the beginning of the cruise, a primary/DL (S/N 3441) and secondary/UL (S/N 150), working well. The secondary is synced to the primary to follow a staggered ping rate of 1.3 and 1.6 seconds, designed to mitigate acoustic reflection depth issues. The UL made use of the Teledyne RDI WM15 surface-/bottom-tracking command, while the DL did not, though the use of this command is arbitrary for the purposes of bottom-tracking during this cruise. Data quality for the duration of the cruise is generally good, with typically negligible issues associated with the following events:
Upon recovery at station 029 the UL would not respond to the Ldownload prompt. A full reset procedure – including software checks (Lreset), complete cable reconfiguration, and a power assessment – was conducted and it was determined that the issue was the UL, itself. The instrument was replaced with a spare LADCP of the same model (S/N 754), after which system operations returned to normal. The entire system configuration was refastened to the rosette, the battery reset in its tray, and again tested positive for operation. UL data were lost for this cast, and DL data appear to end deep during the upcast (5530.2 m) but is otherwise fine according to initial quality checks. The new UL and original DL were used for the duration of the cruise.
During the first half of the cruise, the battery was twice temporarily removed during CTD troubleshooting, without issue (stations 009 and 028).
For some of the deepest casts (> 6000 m, stations 027, 031), the seabed would be at the edge of the DL bottom-tracking range, causing erroneous values for seabed depth when using Lcheck. Despite this, the processing software could correctly determine seabed depth from the data.
At station 046, the Lstart command was given with the deck and star-cable extensions connected in a ‘crossed’ configuration, so that the DL was detected as the UL, and vice versa, and the WM15 commands were leading to a failed start. Before the cause was identified, the LADCP WM15 commands were disabled for both instruments, and so the true UL (which usually runs with WM15 enabled) was cast with WM15 disabled. Upon recovery, inspection of the data revealed the cause, and the data files were revised to reflect the correct DL and UL configuration. The initial data quality-checks suggest that the data are fine.
In the second half of the cruise, the installed battery began to show extended charging times and low voltage, particularly after combined bio- and deep-casts. When it began to no longer reach ‘trickle-charge’ (~80%) between casts, it was deemed unusable and swapped for a spare battery. Another spare was strapped to the deck near the rosette staging area for emergency access. The replacement battery continued to work optimally for the duration of the cruise. However, despite reaching full charge consistently and quickly between casts, the voltage of the replacement did appear to be slowly falling during the last few stations.
A cabling adjustment before station 071 placed a bulk of coiled CTD wire adjacent to the UL, potentially problematic for the ADCP’s magnetic components, but does not appear to have affected data quality.
Attempting to account for a lack of scatterers in the deep regions of the latter half of the cruise, the command files for both the DL and UL were adjusted (station 080) for larger depth bins (8 m changed to 10 m), less blanking distance (first bin changed to 4m), and lower ambiguity velocity (4 m/s changed to 2.5 m/s). The introduction of these adjustments may have led to the detection of cast intermittent wake effects, manifesting as a region of poor vertical velocity data around 3400 m, from the DL. After a further adjustment of the DL by 45° CCW (station 093), the issue was no longer detected, and profile quality is good for the remainder of the cruise.
Preliminary results
Though not yet fully QC’d or processed, the horizontal and vertical velocity data show signs of expected mean currents (e.g. Kuroshio), regional eddies, and low-frequency (likely near-inertial, based on qualitative vertical wavelength), highly energetic internal waves near slope, and over seamount, topography.
From vertical velocities, an estimate of vertical kinetic energy (VKE), and therefore turbulent dissipation ( VKE) can be made for each station profile.
However, as there are both DL and UL data contributing to the vertical velocity profile, averaging to determine VKE can be performed at different points in the process.
Determining VKE from the final combined DL and UL vertical velocity profile results in ‘combination VKE’, while first determining VKE from the individual DL and UL profiles and then combining the VKE profiles results in ‘DL & UL VKE’.
From the combined method, dissipation appears to increase near the surface and topography (Figure 2, upper), notably so near slopes and seamounts, exceeding
VKE) can be made for each station profile.
However, as there are both DL and UL data contributing to the vertical velocity profile, averaging to determine VKE can be performed at different points in the process.
Determining VKE from the final combined DL and UL vertical velocity profile results in ‘combination VKE’, while first determining VKE from the individual DL and UL profiles and then combining the VKE profiles results in ‘DL & UL VKE’.
From the combined method, dissipation appears to increase near the surface and topography (Figure 2, upper), notably so near slopes and seamounts, exceeding  W
W  in some cases.
Away from topography, dissipation can recede to background values less than
in some cases.
Away from topography, dissipation can recede to background values less than  W .
By comparison, the latter method results in generally higher values of VKE (Figure 2, lower), with less obvious features near topography and additional data gaps.
Statistically, these assumptions are confirmed (Figure 3) – the combined method has a greater range of intensity, while the latter method trends toward its mean, higher than that of the combined method.
The correlation between the two methods results is good, but there is an obvious difference at an r-value of 0.82.
Further analysis will be required to decide which method is most appropriate.
W .
By comparison, the latter method results in generally higher values of VKE (Figure 2, lower), with less obvious features near topography and additional data gaps.
Statistically, these assumptions are confirmed (Figure 3) – the combined method has a greater range of intensity, while the latter method trends toward its mean, higher than that of the combined method.
The correlation between the two methods results is good, but there is an obvious difference at an r-value of 0.82.
Further analysis will be required to decide which method is most appropriate.
Figures
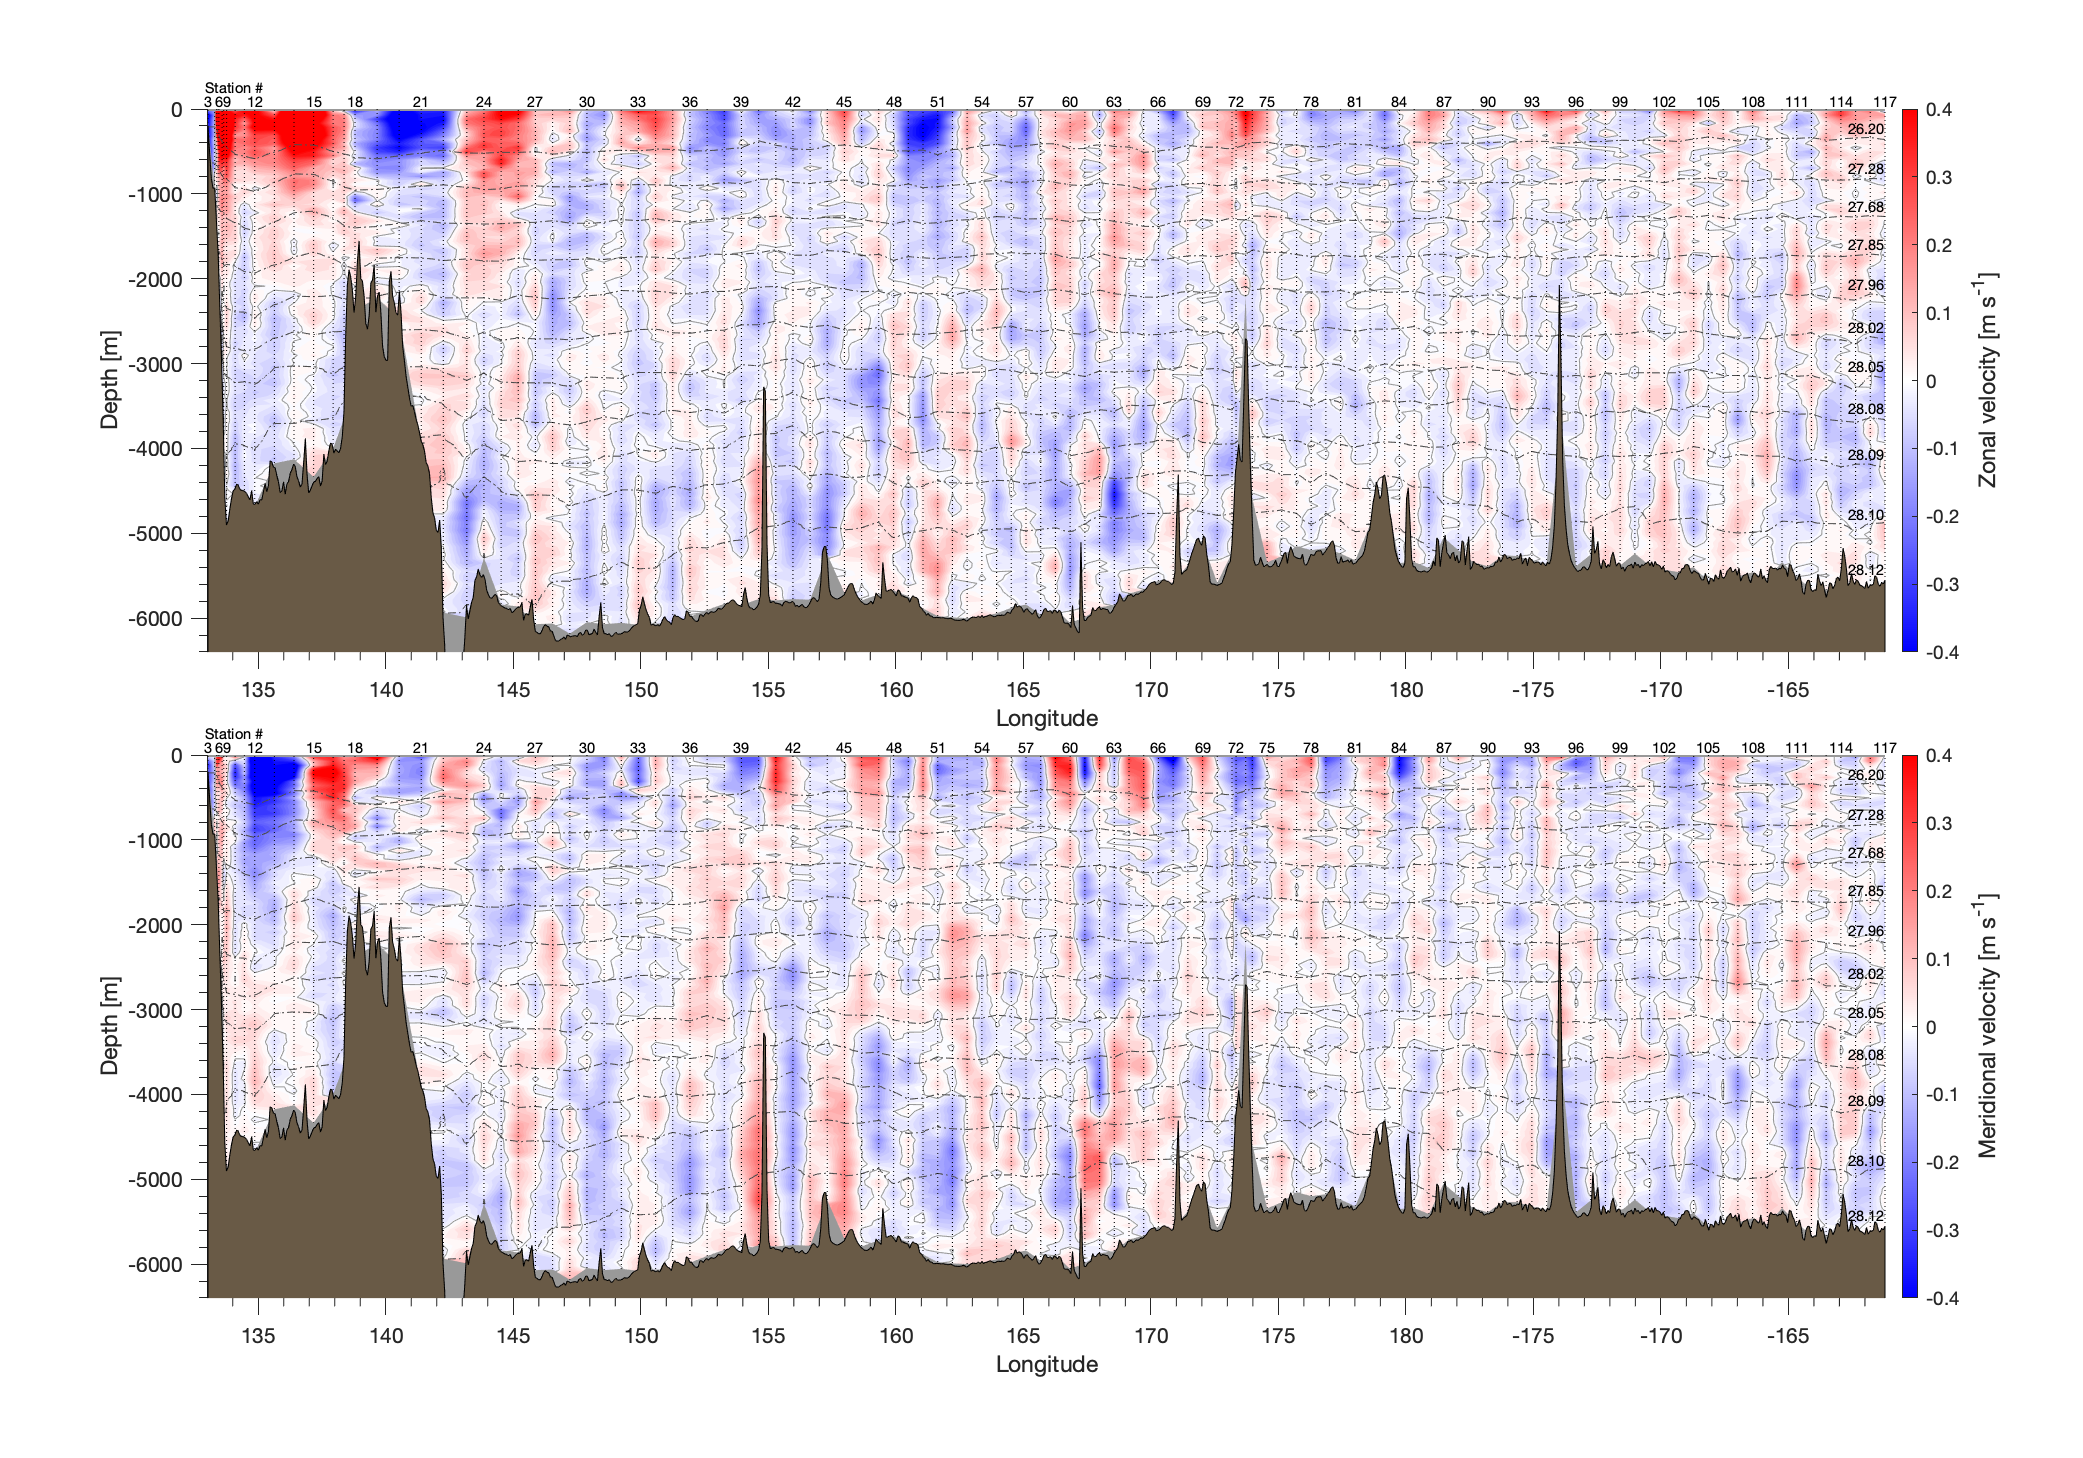
Figure 1. Zonal (upper) and meridional (lower) velocity sections for GO-SHIP P2 leg 1.
Horizontal velocity data were smoothed for vertical scales < 50 m, to filter instrument noise, and are constrained by time- and GPS-synchronised CTD, SADCP, and bottom-tracking data by LDEO_IX software.
Station profiles are shown as vertical dotted gray lines, zero-velocity contours as thin grey lines, and dot-dashed black lines are neutral density contours ([Jackett1997]), labelled right (units of kg  ).
Interpolated data were blanked linearly between stations, near the seabed, with bathymetry determined from ETOPO1 global relief data ([NOAA2009]).
There is evidence of regional mean currents, eddies, and internal wave activity near topography.
).
Interpolated data were blanked linearly between stations, near the seabed, with bathymetry determined from ETOPO1 global relief data ([NOAA2009]).
There is evidence of regional mean currents, eddies, and internal wave activity near topography.
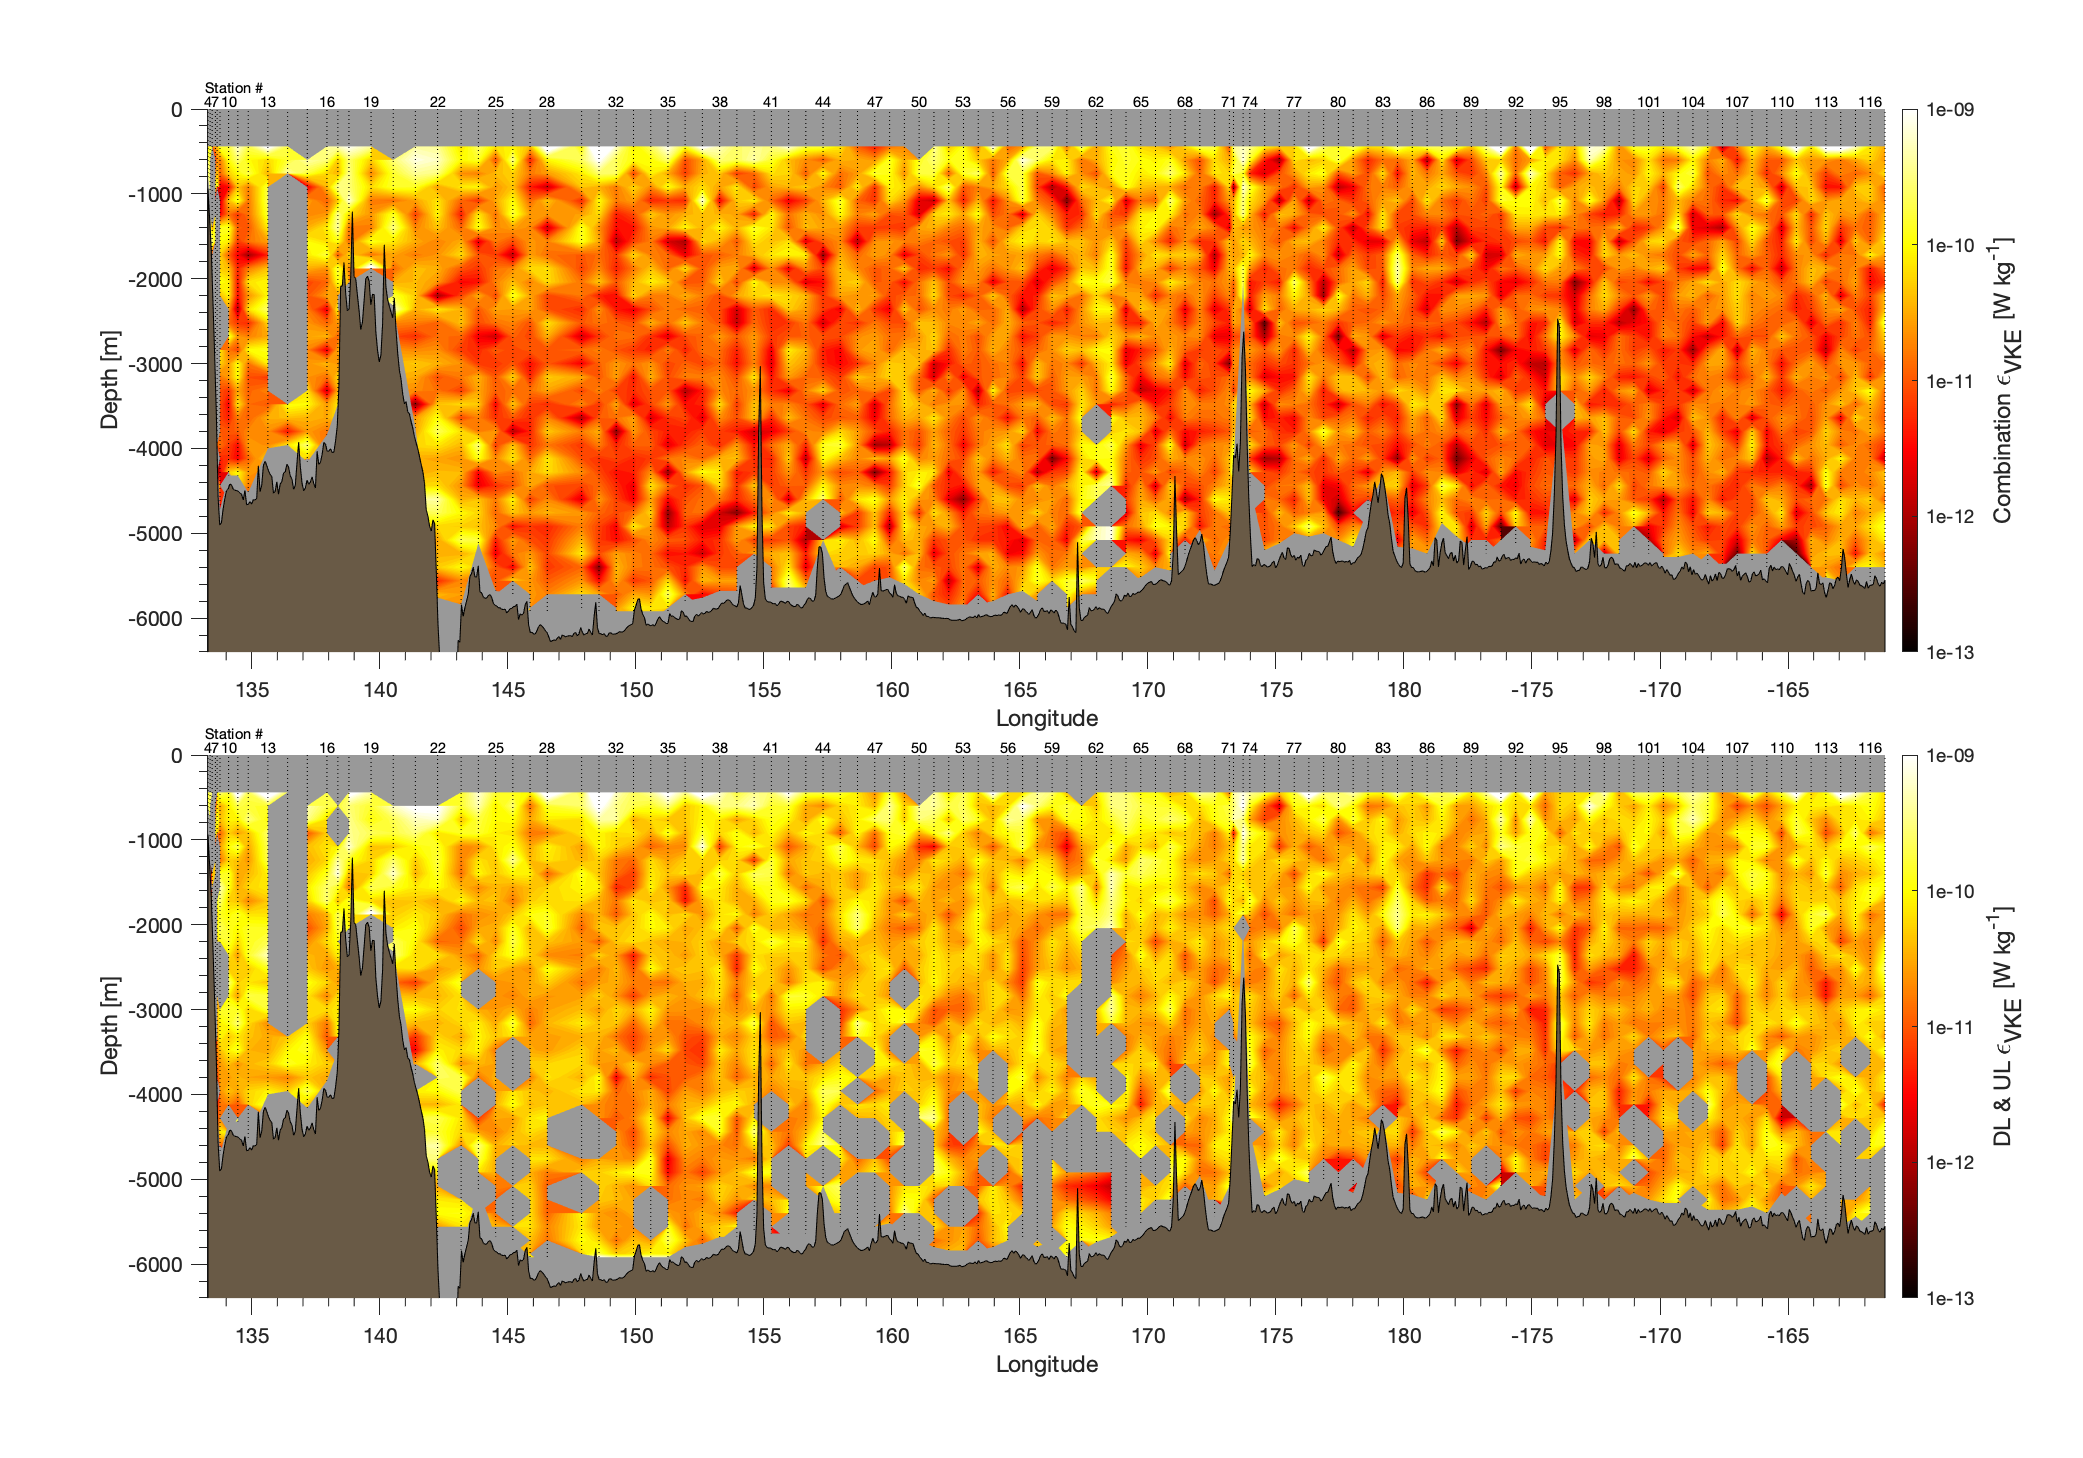
Figure 2. Section plots of combination VKE (upper) and DL & UL VKE (lower).
Interpolated data were blanked linearly between stations, near the seabed, with bathymetry determined from ETOPO1 global relief data ([NOAA2009]).
There is evidence of enhanced dissipation near the surface and topography.
The averaging method in the upper panel better resolves these features.
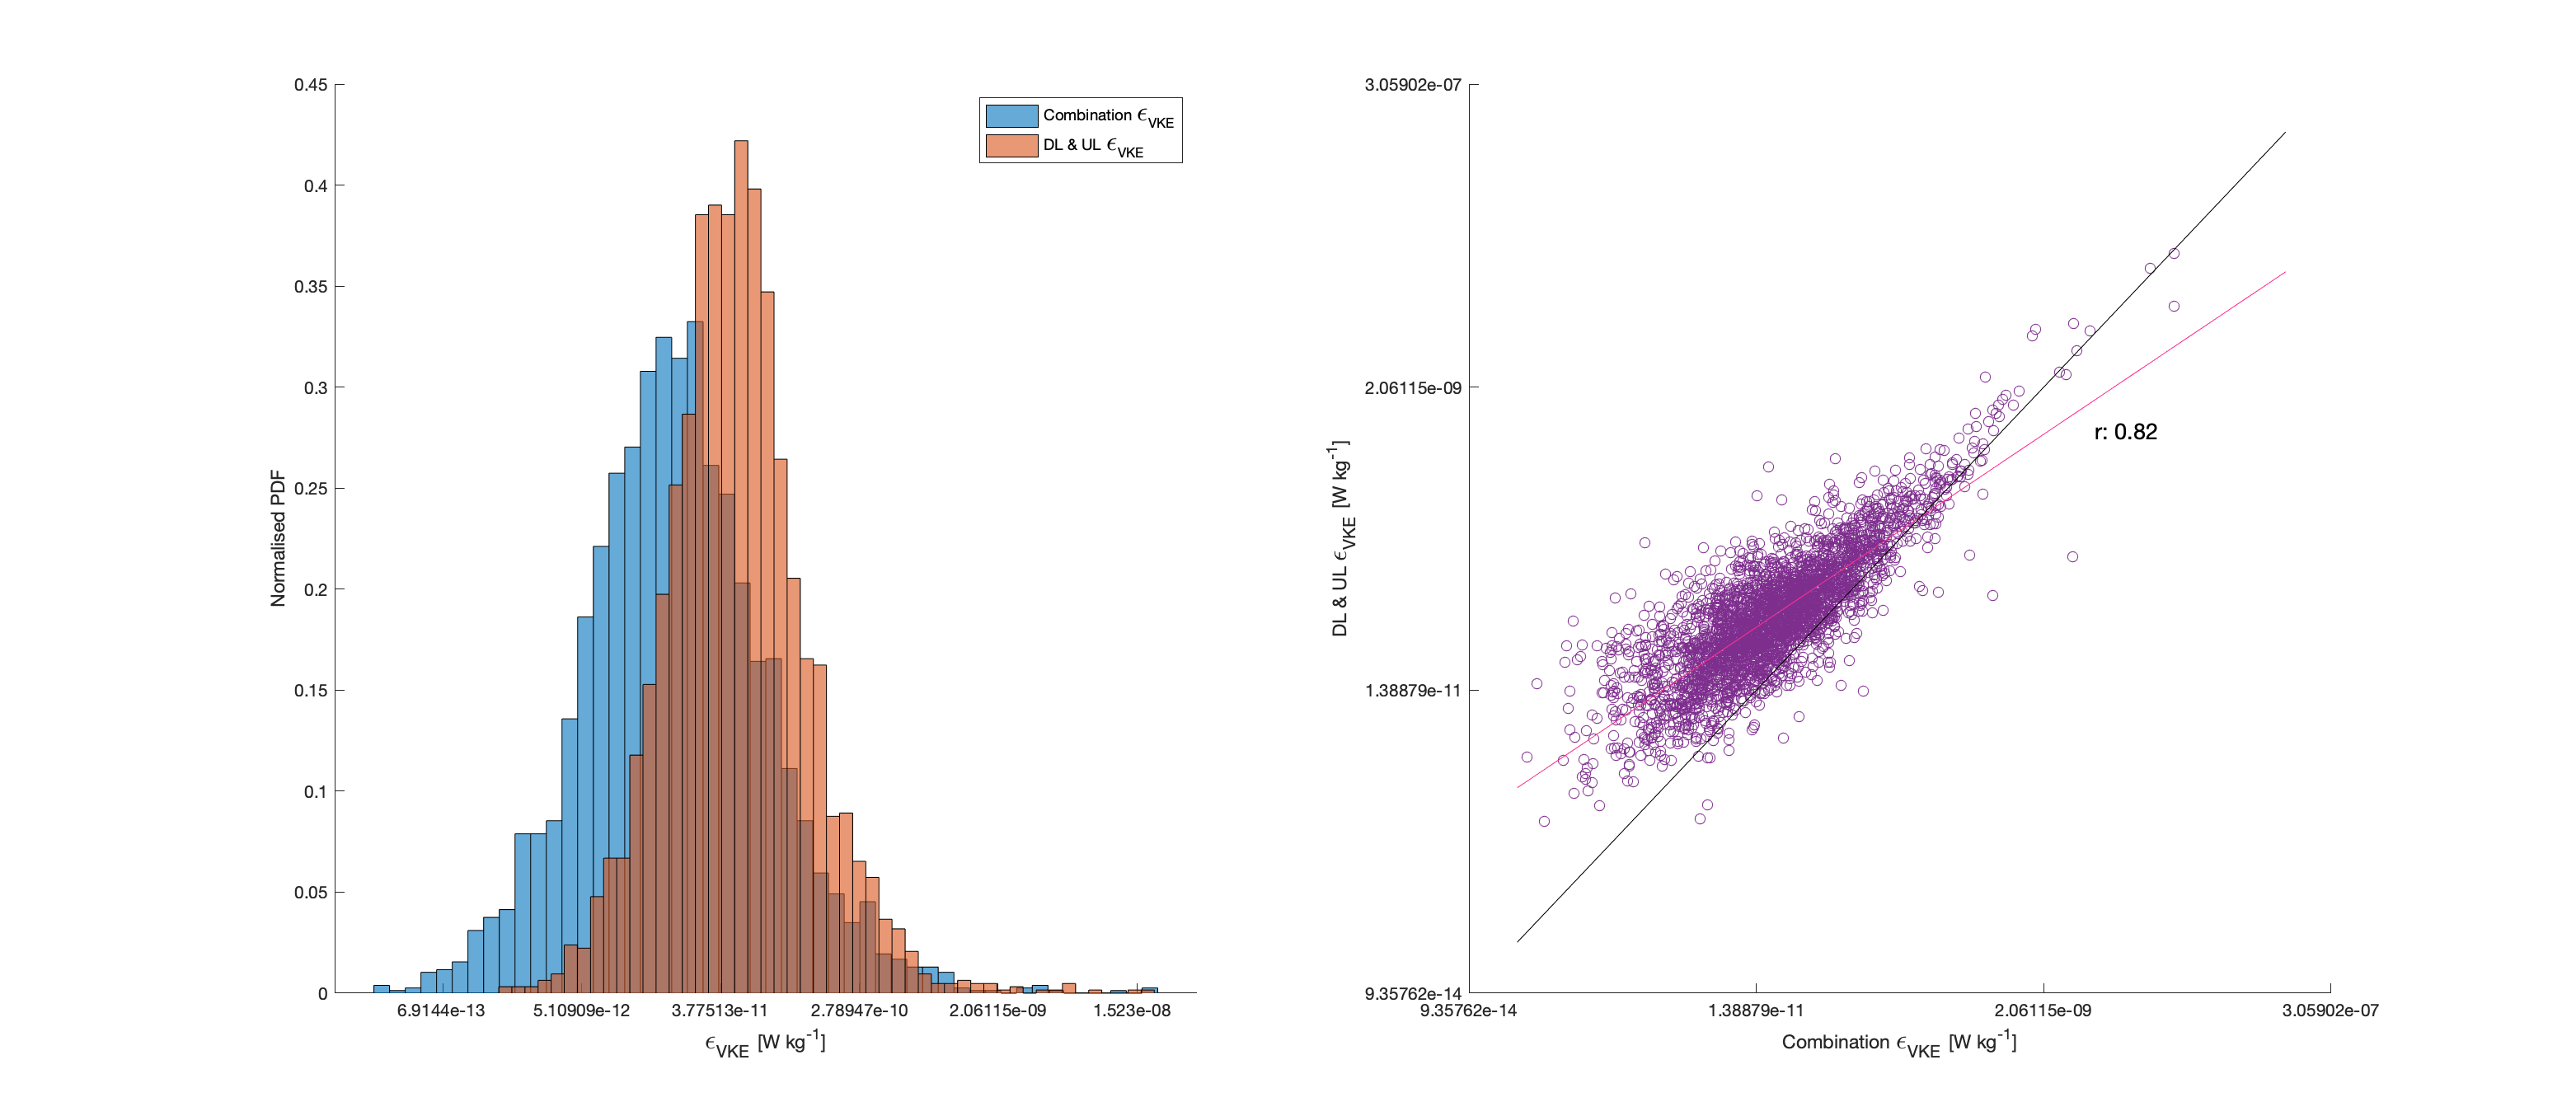
Figure 3. Statistics for combination VKE and DL & UL VKE averaging methods.
The former method has a greater range of intensities, while the later trends towards its greater mean.
The two methods are correlated at r = 0.82.
- Jackett1997
Jackett, David R., Trevor J. McDougall, 1997: A Neutral Density Variable for the World’s Oceans. J. Phys. Oceanogr., 27, 237–263. doi: 10.1175/1520-0485(1997)0272.0.CO;2
- NOAA2009(1,2)
NOAA National Geophysical Data Center. 2009: ETOPO1 1 Arc-Minute Global Relief Model. NOAA National Centers for Environmental Information. Accessed May 25, 2022.